Derivation of the Demand
Curve in Terms of Utility Analysis:
Dr. Alfred Marshal was of the view that the law of
demand and so the demand curve can be derived with the help of utility analysis.
He explained the derivation of law of demand:
(i) In the case of a single
commodity and (ii) in the case of two or more than two commodities. In the
utility analysis of demand, the following assumptions are made:
Assumptions:
(i) Utility is cardinally measurable.
(ii) Utilities of different commodities are
independent.
(iii) The marginal utility of money to the consumer
remains constant.
(Iv) Utility gained from the successive units of a
commodity diminishes.
(1)
Derivation of Demand Curve in the Case of a Single Commodity (Law of Diminishing
Marginal Utility):
Dr. Alfred Marshall derived the demand curve with
the aid of law of diminishing marginal utility. The law of diminishing marginal
utility states that as the consumer purchases more and more units of a
commodity, he gets less and less utility from the successive units of the
expenditure. At the same time, as the consumer purchases more and more units of
one commodity, then lesser and lesser amount of money is left with him to buy
other goods and services.
A rational consumer, before, while purchasing a
commodity compares the price of the commodity which he has to pay with the
utility of a commodity he receives from it. So long as the marginal utility of a
commodity is higher than its price (MUx > Px), the
consumer would demand more and more units of it till its marginal utility is
equal to its price MUx = Px or the equilibrium condition
is established.
To put it differently, as the consumer consumes more
and more units of a commodity, its marginal utility goes on diminishing. So it
is only at a diminishing price at which the consumer would like to demand more
and more units of a commodity.
Diagram/Curve:
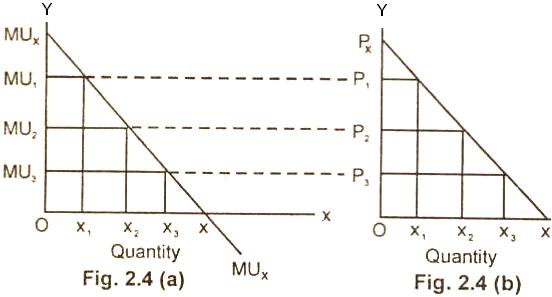
In fig. 2.4 (a) the MUx is negatively
slopped. It shows that as the consumer acquires larger quantities of good x, its
marginal utility diminishes. Consequently at diminishing price, the quantity
demanded of the good x increases as is shown in fig. 2.4 (b).
At X1,
quantity the marginal utility of a good is MU1. This is equal to P1
by definition. The consumer here demands OX1 quantity of the
commodity at P1 price. In the same way X2 quantity of the
good is equal to P2. Here at P2 price, the consumer will
buy OX2 quantity of commodity. At X3 quantity the marginal
utility is MU3, which is equal to P3. At P3,
the consumer will buy OX3 quantity and so on.
We conclude from above, that as the purchase of the
units of commodity X are increased, its marginal utility diminishes. So at
diminishing price, the quantity demanded of good X increases as is evident from
fig. 2.4 (b). The rational supports the notion of down slopping demand curve
that when price falls, other things remaining the same, the quantity demanded of
a good increases and vice verse. (The negative section of the MU curve does not
form part of the demand curve, since negative quantities do not make sense in
economics).
(2)
Derivation of the Demand Curve in the Case of Two or More than Two Commodities
(Law of Equi-Marginal Utility):
The law of diminishing marginal utility can also be
applied in case of two or more than two goods. When a consumer has to spend a
certain given income on a number of goods, he attains maximum satisfaction when
the marginal utilities of the goods are proportional to their prices as stated
below.
MUx / Px = MUy /
Py = ……….. MUn / Pn
Derivation of
Demand Curve:
In the fig. 2.5 (a), (b) and (c) given the money income, the price
of X commodity (Px) and the price of Y commodity (Py) and
constant marginal utility of money (MUm), the demand curve derived is
illustrated. The consumer allocates his money income between X and Y commodities
to get OQ1 units of good X and OY unit of good Y commodities because
the combination correspondence to:
MUx / Px = MUy /
Py = MUm
At the OM level (constant).
Diagram/Curve:
.JPG)
.JPG)
.JPG)
Let us assume that money income and price of Y
commodity remain constant but the price of X commodity decreases. As a result of
this money expenditure on commodity X rises resulting MUx / Px
curve to shift towards right. The consumer now allocates his income to OQ2
quantity of X commodity and Oy quantity of Y commodity because the
combinations correspondence to
MUx / Px
= MUy / Py = MUm
(constant) at OM level.
Thus in response to decrease in the price from Px to
Px1, the quantity demanded of a good X increases from OQ1 to OQ2.
The DD is a negatively sloped demand curve.
Relevant Articles:
|