Home Page                      Contact Us                      About Us                      Privacy Policy                       Terms of Use                      Advertise 
 

Home » Elasticity of Supply » Measurement of Elasticity of Supply


Measurement of Elasticity of Supply:


Definition and Explanation:


Elasticity of supply can be measured on the very same lines as we measured the elasticity of demand. Elasticity of supply can either be equal to unity or greater than unity or less than unity.


Equal to Unity:


If a, change in the quantity supplied, and a change in the price vary in equal proportion, the ratio will be equal to one and the elasticity of supply will be equal to unity.


Diagram/Figure and Schedule:


This is shown with the help of the schedule and the diagrams given below:


Price ($) Quantity Supplied (Kg)
1 10
2 20
3 30


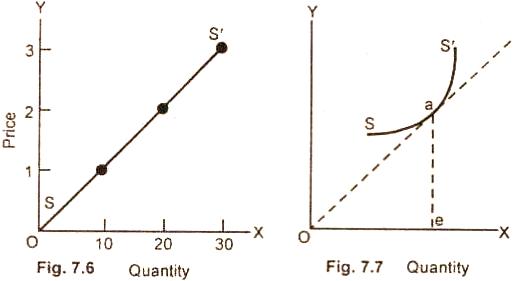
If the supply curve is a straight line and is also equal to unity, it will pass through the origin as is shown in Fig. 7.6. If the point on the arc supply curve is such that the tangent passes through the origin, the elasticity at the point will also be equal to unity as is shown in Fig. 7.7.


Greater than Unity:


If a change of 1 percent in price leads to more than 1 percent change in supply, the elasticity is said to be greater than unity.


This is shown with the help of the schedule and the diagrams given below:


Price ($) Quantity Supplied (Kg)
1 10
2 25
3 45


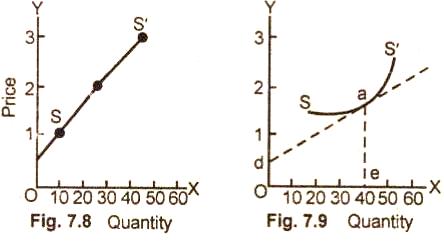
In Fig. 7.8, the supply curve SS/ cuts the Y-axis, the elasticity is greater than unity. If the supply curve is an arc, then the point on the curve whose tangent cuts the price axis will have elasticity greater than unity as is shown in diagram 7.9.


Less than Unity:


If a 1 percent change in price is accompanied by less than 1 percent change in supply, the elasticity of supply is said to be less than unity.


Price ($) Quantity Supplied (Kg)
1 10
2 15
3 17


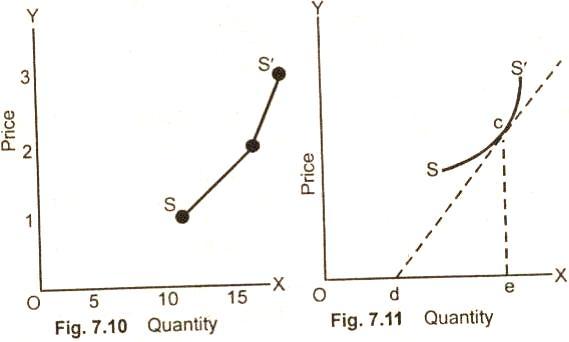
If the supply curve cuts the X-axis, the elasticity will be less that unity as is shown in fig. 7.10, and Fig. 7.11. The tangent at point C intersects the X-axis at the point d. This means elasticity of supply is less than one.

Relevant Articles:

» Price Elasticity of Supply
» Categories of Price Elasticity of Supply
» Determinants of Price Elasticity of Supply
» Measurement of Elasticity of Supply
 

Principles and Theories of Micro Economics
Definition and Explanation of Economics
Theory of Consumer Behavior
Indifference Curve Analysis of Consumer's Equilibrium
Theory of Demand
Theory of Supply
Elasticity of Demand
Elasticity of Supply
Equilibrium of Demand and Supply
Economic Resources
Scale of Production
Laws of Returns
Production Function
Cost Analysis
Various Revenue Concepts
Price and output Determination Under Perfect Competition
Price and Output Determination Under Monopoly
Price and Output Determination Under Monopolistic/Imperfect Competition
Theory of Factor Pricing OR Theory of Distribution
Rent
Wages
Interest
Profits
Principles and Theories of Macro Economics
National Income and Its Measurement
Principles of Public Finance
Public Revenue and Taxation
National Debt and Income Determination
Fiscal Policy
Determinants of the Level of National Income and Employment
Determination of National Income
Theories of Employment
Theory of International Trade
Balance of Payments
Commercial Policy
Development and Planning Economics
Introduction to Development Economics
Features of Developing Countries
Economic Development and Economic Growth
Theories of Under Development
Theories of Economic Growth
Agriculture and Economic Development
Monetary Economics and Public Finance

History of Money
 

                   Home Page                Contact Us                About Us                Privacy Policy                Terms of Use                Advertise               

All the material on this site is the property of economicsconcepts.com. No part of this website may be reproduced without permission of economics concepts.
All rights reserved Copyright
© 2010 - 2015