Revenue Curves of an Individual Firm Under Perfect Competition:
While discussing the assumptions of perfect competition, we have stated that in a perfect
competition, the number of buyers and sellers is so
large that an individual buyer or an individual seller cannot
influence the market price.
A firm has to sell its products at
the market price prevailing in the market. The buyers have also
perfect knowledge of the quality and prices of the commodities
which they wish to purchase. Similarly, a factor knows the
reward which is paid to the similar factor in the country. In
addition to these, the factors of production are perfectly
mobile. They can freely move from one place to another place,
from one occupation to another occupation, and no artificial
barriers are imposed upon them by the state. The sellers sell
identical and homogeneous goods.
Under the conditions stated above,
there will be one price for the identical goods in all parts of
the market. If any seller wishes to sell its goods at a price
lower than the market price, its goods will be sold in no time
as all the buyers have perfect knowledge of the market. If he
keeps the price higher than the market price, the goods will not
be sold. The seller in order to get the maximum profit will have
to sell its total output at the prevailing market price as is
shown in the two figs. given below:
Diagram/Figure:

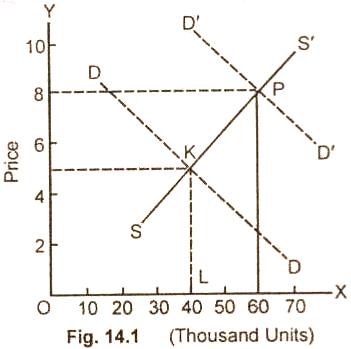
In the fig. (14.1) markets demand
and supply curves intersect at point K. KL, i.e. $5 is the
market price.

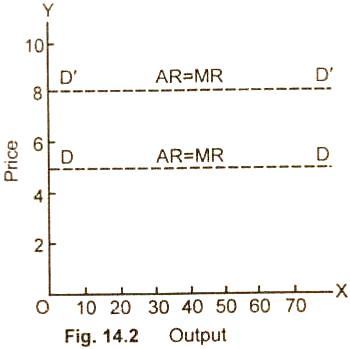
In Fig. (14.2) DD is the demand curve which an
individual firm has to face. A firm whether it produces 5 units
or 50 units has to sell its product at the prevailing market
price, i.e., at $5. If at any time the aggregate demand rises,
and the price settles at PR (i.e., $8), then an individual
seller can sell its products at $8. He will face the new demand
curve D1 D1 as is shown in fig. (14.2).
Under perfect competition, the
additional output is sold at the price at which, the first unit
is sold. The average revenue curve is, therefore, always equal
to marginal revenue and so both the curves AR and MR coincide.
For instance, when the market
prices of a commodity is $5 per unit, the firm sells 10 units.
The total revenue of the firm is $50. If it wishes to sell 11
units, an individual firm cannot alter the market price. So it
has to sell the additional units also at $5. The total revenue
of the firm by selling 11 units will be $5. The addition made to
the total revenue by selling one more unit, i.e.. MR is $5. The
average revenue is also found by dividing the total revenue by
the number of goods sold $( 50 / 10 = 5, 55 / 11 = 5, 60 / 12 =
5). We therefore, find that in perfect competition marginal
revenue, average revenue and price are the same. So these curves
also coincide as is illustrated in the schedule and diagram.
Schedule:
|
Units |
Price Per Unit ($)
|
Total Revenue ($)
|
Marginal ($)
|
Average Revenue ($)
|
|
10 |
5 |
50 |
5 |
5 |
|
11 |
5 |
55 |
5 |
5 |
|
12 |
5 |
60 |
5 |
5 |
|
13 |
5 |
65 |
5 |
5 |
|
14 |
5 |
70 |
5 |
5 |
|
15 |
5 |
75 |
5 |
5 |
|
16 |
5 |
80 |
5 |
5 |
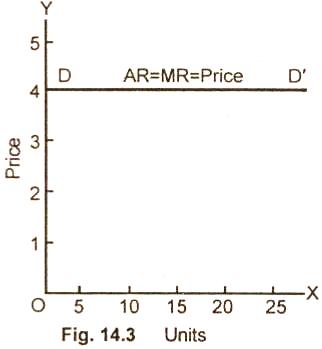
The
demand curve which a firm has to face in a perfect
competitive market is a horizontal straight line parallel to
the quantity axis. The MR and AR curves coincide with the price
line DD/. Here MR = AR = Price as is shown in figure
14.3.

Relevant Articles:
|