Individual's
and Market Demand for a Commodity:
Individual's
Demand for a Commodity:
Definition and Explanation:
"The
individuals demand for a commodity is the amount of a commodity which
the consumer is willing to purchase at any given price over a specified period
of time".
The
individual's demand for a commodity varies inversely price ceteris paribus. As
the price of a goods rises, other things remaining the same, the quantity
demanded decreases and as the price falls, the quantity demanded increases.
Price (p) is
here an independent variable ad quantity (q) dependent variable.
Individual's Demand Schedule:
The demand
schedule of an individual for a commodity is a list or table of the different
amounts of the commodity that are purchased the market at different prices per
unit of time. An individual demand schedule for a good say shirts is presented
in the table below:
Individual Demand Schedule for Shirts:
| Price Per
Shirt ($) |
100 |
80 |
60 |
40 |
20 |
10 |
| Quantity
Demanded Per Year
Qdx |
5 |
7 |
10 |
15 |
20 |
30 |
According to
this demand schedule, an individual buys 5 shirts at $100 per shirt and 30
shirts at $10 per shirt in a year.
Individual's Demand Curve:
Demand curve
is a graphic representation of the demand schedule. According to
Lipsey:
"The curve,
which shows the relation between the price of a commodity and the amount of that
commodity the consumer wishes to purchase is called demand curve".
It is a
graphical representation of the demand schedule.
.JPG)
In the figure
(4.1), the quantity. demanded of shirts in plotted on horizontal axis OX and
price is measured on vertical axis OY. Each price quantity combination is
plotted as a point on this graph. If we join the price quantity points a, b, c,
d, e and f, we get the individual demand curve for shirts.
The DD/
demand curve slopes downward from left to right. It has a negative slope showing
that the two variables price and quantity work in opposite direction. When the
price of a good rises, the quantity demanded decreases and when its price
decreases, quantity .demanded increases, ceteris paribus.
Market Demand for a
Commodity:
Definition and Explanation:
The market
demand for a commodity is obtained by adding up the total quantity demanded at
various prices by all the individuate over a specified period of time in the
market It is described as the horizontal summation of the individuals demand for
a commodity at various possible prices in market.
In a market,
there are a number of buyers for a commodity at each price. In order to avoid a
lengthy addition process, we assume here that there are only four buyers for a
commodity who purchase different amounts of the commodity at each price.
Market Demand Schedule:
The
horizontal summation of individuals demand for a commodity will be the market
demand for a commodity as is illustrated in the following schedule:
A market Demand Schedule in a Four Consumer Market:
|
Price ($)
|
Quantity Demanded |
Quantity Demanded |
Quantity Demanded |
Quantity Demanded |
Total Quantity Demanded Per
Week (in thousands) |
|
First
Buyer
|
Second Buyer |
Third
Buyer |
Fourth Buyer |
|
10
8
6
4
2
|
10
15
25
40
60
|
13
20
30
35
50
|
6
9
10
15
30
|
11
16
20
30
40
|
40
60
85
120
180
|
In the above
schedule, the amount of commodity demanded by four buyers (which we assume
constitute the entire market) differs for each price When the price of a
commodity is $10, the total quantity demanded is 4C thousand units per week. At
price of $2, the total quantity demanded increases to 180. thousand units.
.
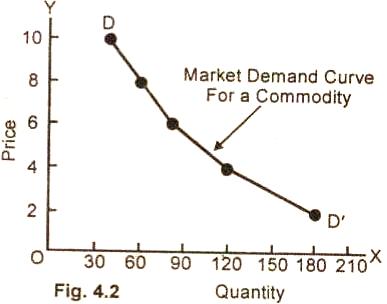
Market Demand Curve:
Market demand
curve for a Commodity is the horizontal sum of individual demand curves of ail
the buyers in a market. This is illustrated with the help of the market demand
schedule given above.

The market
demand curve DD/ for a commodity, like the individual demand curve is
negatively sloped, (see figure 4.2). It shows that under the assumptions
(ceteris paribus) other things remaining the same, there is an inverse
relationship between the quantity demanded and its price.
At price of
$10, the quantity demanded in the market is 40 thousand units. At price of $2.0.
it increases to 180 thousand units. In. other words, the lower the price of the
good X, the greater is the demand for it ceteris paribus.
Relevant Articles:
|