J. M. Keynes in his famous book 'General Theory' put forward an analysis of
unemployment and inflation. The Keynesian theory assumes that a maximum level of
national output can be obtained at any particular time in the economy. According
to him the maximum level of national income is generally referred to as full
employment level of national income. If the equilibrium level of national income
coincides with the full employment, there will be no deficiency of aggregate
demand and hence no dis-equilibrium unemployment (seasonal, frictional
unemployment can exist at this level).
Now if the equilibrium level of income as determined by the AD (aggregate
demand) and AS (aggregate supply) is not equal to the level of full employment,
then two situations can arise. Either this equilibrium level will be below the
full employment level or above the lull employment level. In case, the
equilibrium income is below the potential income, it indicates the presence of
recessionary gap. If it is above the full employment income, it shows the
presence of inflationary gap. Both the situations of deflationary and
inflationary gaps are situations of disequilibrium in the economy. These gaps
are now explained with the help of graphs.
Deflationary
Gap/Recessionary Gap:
Definition and
Explanation:
Deflationary gap is also called
re-cessionary gap. When there is an
insufficient demand for goods and services in the economy, the equilibrium will
occur at the lower level of full employment income and to the left of full employment line. In other words, re-cessionary gap occurs when the aggregate
demand is not sufficient to create conditions of full employment.
The
deflationary gap thus is the difference of amount by which aggregate
expenditure falls short of the level needed to generate equilibrium national
income at full employment without inflation.
Example and
Diagram/Figure:
The deflationary gap is
illustrated in figure below:

In this diagram 31.4, the national income is measured on OX axis and
aggregate expenditure on OY axis. Let us assume initially that the aggregate
expenditure curves AE° interests the 45 degree line at point E/ to the left of
full employment line or potential income.
The economy is operating at
equilibrium income level of $150 billion which is below potential income of $250 billion. There is a deficiency of
$100 billion in aggregate
expenditures. This shortfall of national expenditure ($100 billion) below the
potential income or the full employment level of national income is called
Re-cessionary Gap.
Fighting Recession:
When the economy is operating below its potential
income, the government recognizes the re-cessionary gap in aggregate income. It
increases its expenditures to stimulate the economy. The multiplier process
takes over. The increase in government expenditure shifts the AE/ curve from AE°
to AE1 increasing aggregate income to the full employment income level.
Such government action is expansionary fiscal policy.
Deflationary gap thus represents the difference between the actual aggregate
demand and the aggregate demand which is required to establish the equilibrium
at full employment level of Income.
Inflationary Gap:
Definition and
Explanation:
An inflationary gap is just the opposite of deflationary gap. It is said to
exist when equilibrium income exceeds full employment income. It is created due
to the effective demand being in excess of the full employment level. It is the
difference between equilibrium income and full employment income (potential
income) when equilibrium income exceeds the full employment income. Here people
are trying to buy more goods and services than can be produced when all
resources are fully employed. There is too much money chasing too few goods. The
result is that the excess demand pulls up prices and there is inflation. The excess demand for goods and services is being
met in money terms but not real, terms.
Example and
Diagram/Figure:
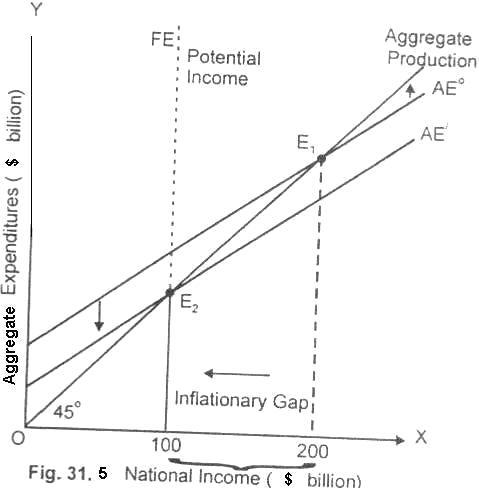
An inflationary gap is explained with the help of figure below:

In this figure 31.5 aggregate expenditure curve AE° intersects the aggregate
production curve (45 degree helping line) at point E/ to the right of potential
line or full employment line (FE).
The equilibrium level of income is $200
billion whereas the potential income is $100 billion. When the equilibrium
income exceeds potential income, there is said to be inflationary gap which in the
diagram is $100 billion. The excess expenditure of $100 billion causes
upward pressure on prices when there is no additional output produced.
Fighting Inflation:
Whenever there is an inflationary gap in the economy, the government adopts
deflationary fiscal policy of lowering government expenditure or raising taxes.
It also adopts deflationary monetary policy for reducing the amount of money in
the economy.
Summing Up:
(i) When equilibrium income is below its potential income level, the
difference is called deflationary gap. The government can increase its
expenditure to stimulate the economy.
(ii) When equilibrium income exceeds the potential income, the difference is
called an inflationary gap. To prevent inflation. Keynes believes that the
government should exercise contractionary fiscal policy, cutting government
expenditure, raising taxes etc.