There are three methods of measuring
price elasticity of demand:
(1) Total Expenditure Method.
(2) Geometrical Method or Point Elasticity
Method.
(3) Arc Method.
These three methods are now discussed in
brief:
(1) Total
Expenditure Method/Total Revenue Method:
Definition,
Schedule and Diagram:
The price elasticity can be measured
by noting the changes in total expenditure brought about by changes in price and
quantity demanded.
(i) When with a percentage fall in
price, the quantity demanded increases so
much that it results in the increase in total expenditure, the
demand is
said to be elastic (Ed
> 1).
For Example:
| Price Per
Unit ($) |
Quantity
Demanded |
Total
Expenditure ($) |
| 20 |
10 Pens |
200.0 |
| 10 |
30 Pens |
300.0 |
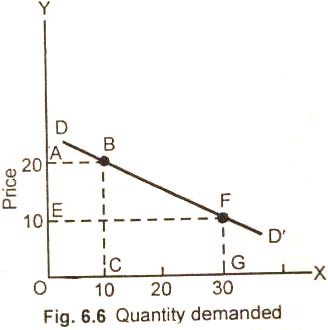
The figure (6.6) shows that at price of
$20 per pen, the quantity demanded
is ten pens, the total expenditure OABC ($200). When the price falls down
to $10, the quantity demanded of pens is thirty. The total expenditure is OEFG
($300).
Since OEFG is greater than OABC, it implies that change in quantity
demanded is proportionately more than the change in price. Hence the demand is
elastic (more than one) Ed > 1.
(ii) When a percentage fall in price
raises the quantity demanded so much as to
leave the total expenditure unchanged, the elasticity of
demand is said to be
unitary (Ed = 1).
For Example:
| Price Per
Pen ($) |
Quantity
Demanded |
Total
Expenditure ($) |
| 10 |
30 |
300 |
| 5 |
60 |
300 |
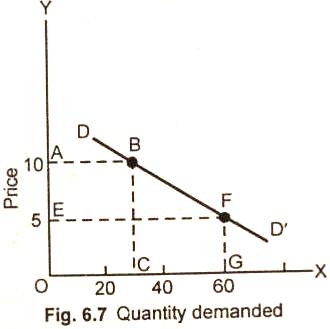
The figure (6.7) shows that at price of
$10 per pen, the total expenditure
is OABC ($300). At a lower price of $5, the total expenditure is OEFG
($300).
Since OABC = OEFG, it implies that
the change in quantity demanded is proportionately equal to change in price. So
the price elasticity of demand is equal to one, i.e., Ed = 1.
(iii) When a percentage fall in price raises the quantity demanded of a good so
as to cause the total expenditure to decrease, the demand is said to be
inelastic or less than one, i.e., Ed < 1.
For Example:
|
Price Per Pen ($) |
Quantity Demanded |
Total Expenditure ($) |
| 5 |
60 |
300 |
| 2 |
100 |
200 |
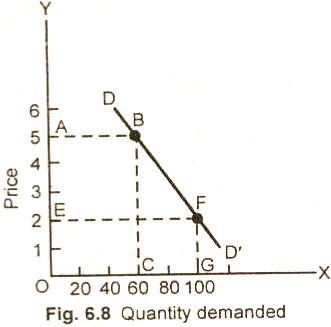
In the fig (6.8) at a price of $5 per pen the quantity demanded is 50
pens. The total expenditure is OABC ($300). At a lower price of $2, the
quantity demanded is 100 pens.
The total expenditure is OEFG ($200). Since OEFG is smaller than OABC, this implies that the change in quantity demanded is
proportionately less than the change in price. Hence price elasticity of demand
is less than one or inelastic.
Note:
As the demand curve slopes downward, therefore, the
coefficient of price
elasticity of demand is always negative. The economists for convenience
sake, omit the negative sign and express the price elasticity of demand by
positive number.
(2) Geometric Method/Point
Elasticity Method:
"The measurement of elasticity at a point of the demand curve is called
point
elasticity".
The point elasticity of demand method is used as a measure of the
change in the quantity demanded in response to a very small changes in price.
The point elasticity of demand is defined as:
"The proportionate change in the
quantity demanded resulting from a very small proportionate change in price".
Measurement of Geometric/Point Elasticity Method:
(i) Measurement of Elasticity on a Linear Demand Curve:
The price elasticity of demand can also be measured at any point on the
demand curve. If the demand curve is linear (straight line), it has a unitary
elasticity at the mid point. The total revenue is maximum at this point.
Any
point above the midpoint has an elasticity greater than 1, (Ed > 1). Here, price
reduction leads to an increase in the total revenue (expenditure). Below the
midpoint elasticity is less than 1. (Ed < 1). Price reduction leads to reduction
in the total revenue of the firm.
Graph/Diagram:
The formula applied for measuring the elasticity at any point on the straight
line demand curve is:
Ed
= %∆q X p
%∆p q
The elasticity at each point on the demand curve can be traced with the
help of point method as:
Ed = Lower Segment
Upper Segment
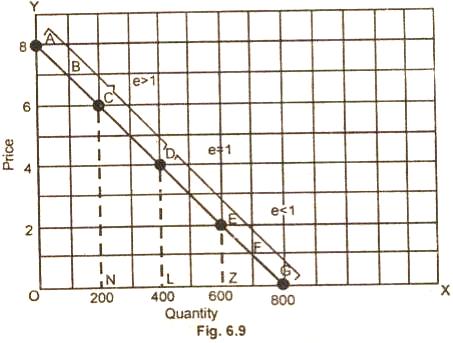
In the figure (6.9) AG is the linear demand curve (1).
Elasticity of demand at its mid point D is equal to unity. At any point to the
right of D, the elasticity is less than unity (Ed < 1) and to the
left of D, the elasticity is greater than unity (Ed > 1).
(1) Elasticity of demand at point D =
DG = 400 = 1 (Unity).
DA 400
(2) Elasticity of demand at point E =
GE = 200 = 0.33 (<1).
EA 600
(3) Elasticity of Demand at point C =
GC = 600 = 3 (>1).
CA 200
(4) Elasticity of Demand at point C
is infinity.
(5) At point G, the elasticity of demand is zero.
Summing up, the elasticity of demand is different at each point along a
linear demand curve. At high prices, demand is elastic. At low prices, it is
inelastic. At the midpoint, it is unit elastic.
(ii) Measurement of Elasticity on a Non
Linear Demand Curve:
If the demand curve is non linear, then elasticity at a
point can be measured by drawing a tangent at the particular point. This is
explained with the help of a figure given below:
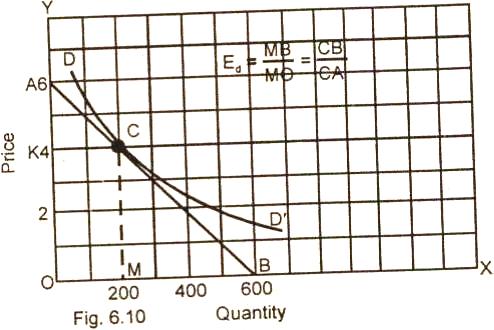
In figure 6.10, the elasticity on DD/
demand curve is measured at point C by drawing a tangent. At point C:
Ed = BM = BC
= 400 = 2 (>1).
MO CA 200
Here elasticity is greater than unity. Point C lies above the midpoint of the
demand curve DD/. In case the demand curve is a rectangular hyperbola, the
change in price will have no effect on the total amount spent on the product. As
such, the demand curve will have a unitary elasticity at all points.
(3) Arc Elasticity:
Normally the elasticity varies along the length of the demand curve. If we
are to measure elasticity between any two points on the demand curve, then the
Arc Elasticity Method, is used. Arc elasticity is a measure of average
elasticity between any two points on the demand curve. It is defined as:
"The average elasticity of a range of points on a demand curve".
Formula:
Arc elasticity is calculated by using the following formula:
-
Ed = ∆q X P1 + P2
∆p q1 + q2
Here:
∆q denotes change in quantity.
∆p denotes change in price.
q1
signifies initial quantity.
q2
denotes new quantity.
P1
stands for initial price.
P2 denotes new price.
Graphic Presentation of
Measuring
Elasticity Using the Arc Method:
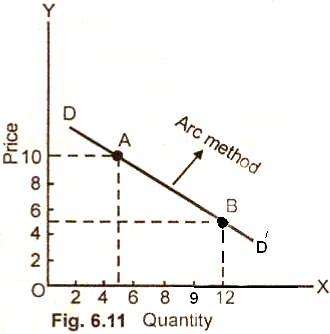
In this fig. (6.11), it is shown that at a price of
$10, the quantity of
demanded of apples is 5 kg. per day. When its price falls from $10 to $5,
the quantity demanded increases to 12 Kgs of apples per day. The arc elasticity
of AB part of demand curve DD/ can be calculated as under:
Ed = ∆q X P1 + P2
∆p q1 + q2
Ed = 7 X 10 +
5 = 7 X 15 = 7 X 15 = 21 = 1.23
5 5 + 12 5 17
5 17 17
The arc elasticity is more than unity.