Monopolies/Monopolist's Demand Curve:
Definition:
Under
perfect competition, the demand curve which an
individual seller has to face is perfectly elastic, i.e., it runs parallel to
the base axis. The competitive seller being unable to affect the market price
sells its output at prevailing market price. Hence marginal revenue, equals the
price of the product. The average revenue is identical to its marginal revenue.
Thus under perfect competition:
Formula:
MR = AR = Price and the
Three Curves
Coincide and are Perfectly Elastic
This is,
however, not the case under monopoly. The
monopolist is the, sole supplier of a
product in the market. He has full powers to make decisions about the pricing of
his product. He is a Price Maker, if he lowers the unit price of his product,
his sale is increased. If he raises the price, he will not lose all his sale.
The demand curve facing the monopolist thus slope downward from left to right.
Explanation:
As the
monopolist's demand curve is negatively sloped, the marginal revenue is here no
longer equal to price or average revenue. It is less than the price (AR) at
every level of output, except the first. The relation between marginal revenue
and average revenue is explained with the help of a schedule and a diagram.
Schedule:
| Price Per Meter in $ |
Quantity Output Meter |
Total Revenue (TR) in
$ |
Marginal Revenue (MR)
in $ |
Average Revenue (AR)
in $ |
| 100 |
1 |
100 |
100 |
100 |
| 80 |
2 |
160 |
60 |
80 |
| 60 |
3 |
180 |
20 |
60 |
| 45 |
4 |
180 |
0 |
45 |
| 35 |
5 |
175 |
-5 |
35 |
In the
above schedule, it is shown that as the monopolist lowers price of his product
from $100 per meter to $80 per meter in specified period of time, the sale
increase from one unit to two units. The total revenue resulting from the sale
of one more unit increases by $60 (MR); whereas the additional unit has been
sold for $80 The reason for the total revenue not to increase by the same amount
is that the price has been reduced for increasing the sale of the extra units.
The price cut is applied to two units of output
sold and not to the additional unit alone. Same is the case with the third,
fourth and fifth units sold. The marginal revenue is less than the price ATR
(AR) for all the units of commodity disposed off in the market.
MR = ΔTR
ΔQ
Diagram/Curve:
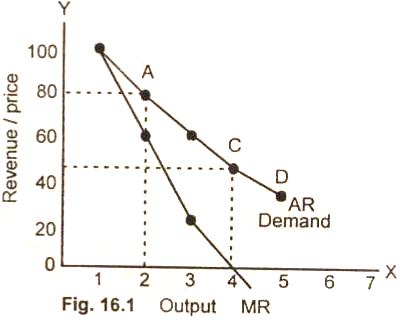
As the
marginal revenue is always less than price, the marginal revenue curve,
therefore, remains below the average revenue curve or demand
curve as is illustrated. In the figure (16.1) the demand curve which
also represents average revenue curve has a downward slope. The demand
curve is downward sloping because the monopolist can sell greater output only by
reducing the price
of units of output.
The
marginal revenue curve of the monopolist always lies below the demand curve
because the marginal revenue from the sale of additional unit of output is less
than its price.
Monopoly Price and Its Relationship to Elasticity of Demand:
The total
revenue test can be applied for explaining the monopoly price and its
relationship to price elasticity of demand. The total revenue
test tells us that when demand is elastic, a decline in price will
increase total revenue. When demand is inelastic, a decline in price of
a good will decrease its revenue.
Applying this test, a
monopolist will fix the amount of his product
at a level where the
elasticity of his average revenue curve is
greater than one (E > 1). It causes
total revenue to increase. Here
marginal revenue is positive. A
monopolist does not push his produce
to the point where the
marginal revenue becomes negative. The
monopolist choice of price when faced with varying degree of
elasticities is now explained with the help of a linear average revenue function
(price line) in fig 16.2.
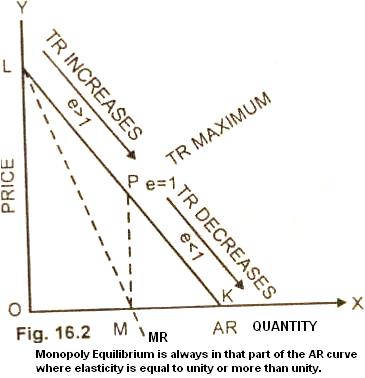
At
midpoint on the down sloping AR curve, elasticity of demand is equal to one,
(E = 1). Above point P, elasticity is greater
than one, (E > 1) and below less than
one (E < 1). At price MP, marginal revenue is zero. At prices above than MP,
MR is positive and below it marginal revenue is negative. The
monopolist would not like to increase his safes up to a point where his MR becomes
negative or his total revenue starts decreasing. The monopolist chooses
the price quantity combination where the MR is positive and the
elasticity of demand is more than one.
Relevant Articles:
|
