Marginal Cost
(MC):
Definition:
Marginal Cost is an increase
in total cost that results from a one unit increase in output.
It is defined as:
"The cost that results from a one unit change
in the production rate".
Example:
For example, the total cost of
producing one pen is $5 and the total cost of producing two pens
is $9, then the marginal cost of expanding output by one unit is
$4 only (9 - 5 = 4).
The marginal cost of the second unit
is the difference between the total cost of the second unit and
total cost of the first unit. The marginal cost of the 5th unit
is $5. It is the difference between the total cost of the 6th
unit and the total cost of the, 5th unit and so forth.
Marginal Cost is governed only by
variable cost which changes with changes in output. Marginal
cost which is really an incremental cost can be expressed in
symbols.
Formula:
Marginal Cost = Change in Total
Cost = ΔTC
Change
in Output Δq
The readers can easily understand
from the table given below as to how the marginal cost is
computed:
Schedule:
|
Units of Output
|
Total Cost
(Dollars) |
Marginal Cost (Dollars) |
|
1 |
5 |
5 |
|
2 |
9 |
4 |
|
3 |
12 |
3 |
|
4 |
16 |
4 |
|
5 |
21 |
5 |
|
6 |
29 |
8 |
Graph/Diagram:

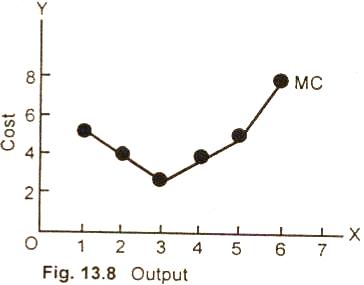
MC curve,
can also be plotted graphically. The marginal cost curve in
fig. (13.8) decreases sharply with smaller Q output and reaches
a minimum. As production is expanded to a higher level, it
begins to rise at a rapid rate.
Long Run Marginal Cost Curve:
The long run marginal cost curve like the long run average cost
curve is U-shaped. As production expands, the marginal cost
falls sharply in the beginning, reaches a minimum and then rises
sharply.
Relationship Between Log Run
Average Cost and Marginal Cost:
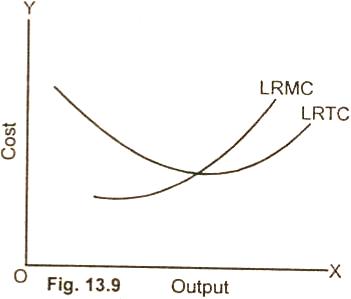
The relationship between the
long run average total cost and log run marginal cost can be
understood better with the help of following diagram:

It is clear from the diagram (13.9),
that the long run marginal cost curve and the long run average
total cost curve show the same behavior as the short run
marginal cost curve express with the short run average total
cost curve. So long as the average cost curve is falling with
the increase in output, the marginal cost curve lies below the
average cost curve.
When average total cost curve begins to
rise, marginal cost curve also rises, passes through the minimum
point of the average cost and then rises. The only difference
between the short run and long run marginal cost and average
cost is that in the short run, the fall and rise of curves LRMC
is sharp. Whereas In the long run, the cost curves falls and
rises steadily.
Relevant Articles:
|