Price Line or Budget Line:
Definition and Explanation:
The
understanding of the concept of budget line is essential for knowing the theory
of consumer’s equilibrium.
"A budget line or price line represents the various
combinations of two goods which can be purchased with a given money income and
assumed prices of goods".
For example, a consumer has weekly income of $60.
He purchases only two goods, packets of biscuits and packets of coffee. The
price of each packet of biscuits is $6 and the price of each packet of
coffee is $12. Given the assumed income and the price, of the two goods, the
consumer can purchase various combination of goods or market combination of
goods weekly.
Schedule:
The various
alternative market baskets (combinations of goods) are shown in the table below:
|
Market Basket |
Packets of Biscuits Per Week |
Packets of Coffee Per Week |
| A |
10 |
0 |
| B |
8 |
1 |
| C |
6 |
2 |
| D |
4 |
3 |
| E |
2 |
4 |
| F |
0 |
5 |
|
Income $60 Per Week = Packets of Biscuits Costs $6 = Packets of Coffee
is Priced $12 Each |
(i) Market
basket A in the table above shows that if the whole amounts of $60 is spent
on the purchase of biscuits, then the consumer buys 10 packets of biscuits
at a price of $6 each and nothing is left to purchase coffee.
(ii) Market
basket F shows the other extreme. If the consumer spends the entire amount
of $60 on the purchase of coffee, a maximum of 5 packets of coffee can be
purchased with it at a price of $12 each with nothing left over for the
purchase of biscuits.
(iii) The
intermediate market baskets B to E shows the mixes of packets of biscuits
and packets of coffee that the cost a total of $60. For example, in
combination of market basket C, the consumer can purchase 6 packets of
biscuits and 2 packets of coffee with a total cost of $60. Budget Line:
The budget
line is an important element analysis of consumer behavior. The indifference map
shows people’s preferences for the combination of two goods. The actual choices
they will make, however, depends on their income. The budget line is drawn as a
continuous line. It identifies the options from which the consumer can choose
the combination of goods.
Diagram/Figure:
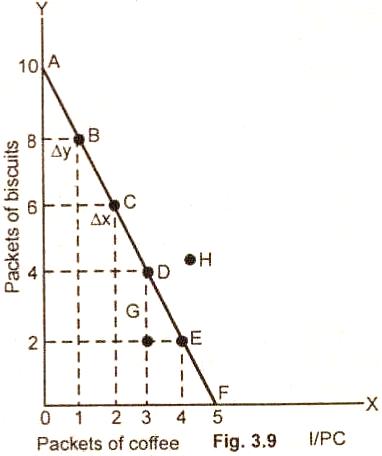
In the fig.
3.9 the line AF shows the various combinations of goods the consumer can
purchase. This line is called the budget line.
It shows 6
possible combinations of packets of biscuits and packets if coffee which a
consumer can purchase weekly. These combinations are indicated by points A, B,
C, D, E and. Point A indicates that 10 packet of biscuits can be purchased if
the entire income of $60 is devoted to the purchase of biscuits. Similarly,
point F shows the purchase of 5 packets of coffee for the entire income of $60
per week.
The budget
line AF indicates all the combinations of packets of biscuits and packets of
coffee which a consumer can buy given the assumed prices and income. In case, a
consumer decides to purchase combination of goods inside the budget line such as
G, then it involves a total outlay that is smaller then the amount of $60
per week. Any point outside the budget line such as H requires an outlay larger
than the consumer’s weekly income of $60.
The slope of
the budget line indicates how many packets of biscuits a purchaser must give up
to buy one more packet of coffee. For example, the slope at point B on the
budget line is ∆Y / ∆X or two packets of biscuits 1 = packet of coffee. This
indicates that a move from B to C involves sacrificing two packets of biscuits
to gain an additional one packet of coffee. Since AF budget line is straight,
the slope is constant at -2 packets of biscuits per one packet of coffee at all
points along the line.
Shifts in Budget Line:
The price
line is determined by the income of the consumer and the prices of goods in the
market. If there is a change in the income of the consumer or in the prices of
goods, the price line shifts in response to a exchange in these two factors.
(i) Income
changes: When there is change in the income of the consumer, the prices of
goods remaining the same, the price line shifts from the original position. It
shifts upward or to the right hand side in a parallel position with the rise in
income.
A fall in the
level of income, product prices remaining unchanged, the price line shifts left
side from the original position. With a higher income, the consumer can purchase
more of both goods than before but the cost of one good in terms of the other
remains the same.
.JPG)
In the fig.
3.10 (a), a change in income is shown when product prices remain unchanged. The
rise in income results in a parallel upward shifts in the budget line from L/ M/
to L2M2. The consumer is able to purchase more of both the goods A and B.
(ii) Price
changes. Now let us consider that there is a change in the price of one
good. The income of the consumer and price of other good is held constant. When
there is a fall in the price of one good say commodity A, the consumer purchases
more of that good than before. A price change causes the budget line to rotate
about point L fig. 3.10 (b).
.JPG)
It becomes
flatter and give the new budget line from LM/ to LM2. A
flatter budget line means that the relative price of the good A on
the horizontal axis is lower. If the greater amount is spent on the purchase of
good A, the consumer can buy increased OM2 amount of good A.
Relevant Articles:
|