Backward Bending Supply Curve
of Labor:
Definition:
"Wages can
increase to a point where less labor is offered in the market".
Explanation:
We have stated earlier those supply curves are
positively sloped. There can be sometime exceptions to the rule there is a
backward bending supply curve of labor as is illustrated in the following
schedule and a diagram.
Schedule:
|
Wage Rate (in Dollars) |
Working Hour (per day) |
|
10 |
10 |
|
20 |
12 |
|
30 |
13 |
|
50 |
10 |
Diagram/Figure:

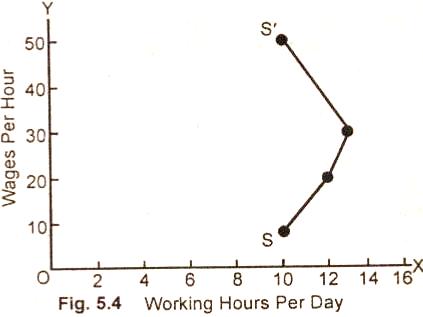
In the figure (5.4), a labor is willing to work for
10 hours a day at a wage rate of $10 per hour. When the wage rate increases to
$30 per hour, he puts in 13 hours of work. If wage rise to $50, he then prefers
leisure to work and is willing to work for 10 hours only. The supply curve SS/
shows that a worker puts in less labor when wage rate rises above $30 per hour.
The supply of labor then is negatively slopped and is backward bending.
The reasons of the backward bending supply curve of
labor are:
(i) The substitution of leisure for work.
(ii) Increase in income which
leads to rise in demand of normal commodities including leisure.
Relevant Articles:
|