Difference Between Shift in Supply Curve and Movement:
Movement Along with the
Same Supply Curve:
While
explaining the
law of supply we have stated that as price rise, the quantity
supplied increases and as price falls the quantity supplied increases and as
price provided other things remain the same. This change in the quantity
supplied of a commodity is a movement of one price quantity combination to
another on the same supply curve. Such a movement at varying prices is now
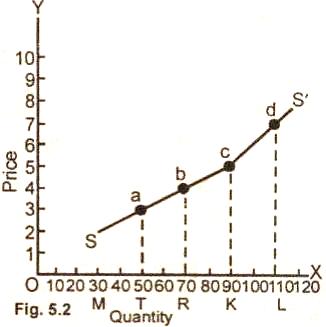
illustrated with the help of the supply curve given in figure 5.2.
Diagram/Figure:

Figure of Movement:
In the above
figure (5.2) at price "aT" ($3.00), "aT" 50 units quantity is supplied. When price
rises to dL ($7.0), the quantity supplied by the producers increases to OL (110
units). The change in quantity supplied at varying prices is referred as
movement along the same supply curve.
Shifts in Supply Curve:
Shifts in supply
curve means
changes in supply. While explaining the
law of supply, we have stated that that
other things remaining the same (ceteris paribus) the amount of the commodity
offered fore sale increases with the rise in price and decreases with a fall in
price. When there is an increase in supply due to one or more than one non-price
factor (which was held constant) such as production techniques, resource prices,
changes in the price of other commodities, etc., there is a rise in supply. The
entire supply curve shifts to the right of original supply curve indicating that
more quantity is offered fore sale at the same price per time period.
If due to one or a
combination of non-price factors, less
quantity is brought into the market fore sale at each price, the supply is said
to have fallen. In case of fall in supply, the supply curve shifts to the left of
the original supply curve. The rise and fall of supply curve (shifts in supply
curve) is
explained with the help of an imaginary schedule and a diagram.
Schedule of Shifts in Supply Curve:
Supply schedule of
shifts:
|
Price per
shirt
(Dollars ) |
Original
quantity
Supplied per
Week |
Rise in supply |
Fall in supply
|
|
50 |
200 |
320 |
140 |
|
40 |
160 |
200 |
100 |
|
30 |
100 |
150 |
70 |
|
20 |
39 |
100 |
15 |
Figure
of Shifts in Supply Curve:

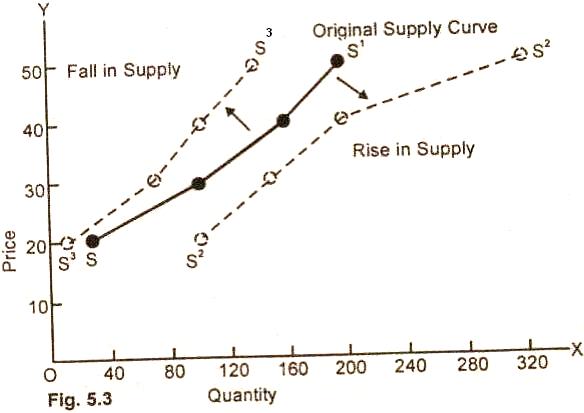
In the figures (5.3) SS/
in the original supply curve S2S2 to the right of
the original supply curve shows an increase in the quantity supplied at each
price. S3S3 supply curve to the left of original supply
curve to the left of original supply curve indicates a decrease in supply at
each price over a specified period of time.
Relevant Articles:
|