Law of Costs:
Definition and Explanation:
Law of Costs is also
known as laws of returns. As an industry is expanded with the
increased investment of resources, the marginal cost (i.e., the
amount which is added to the total cost when the output is
increased by one unit) decreases in some cases, increases in
others and in some, it remains the same. This tendency on the
part of the marginal cost to fall, rise or to remain the same as
output is expanded, is described in economics as the law
of diminishing costs, the law of increasing costs, and the law
of constant costs.
If we know the money cost of a unit
of a factor invested in a particular industry, then the marginal
cost can be derived easily dividing the money cost of a unit of
factor by its marginal return.
The following table will make clear
as to how the marginal cost decreases with the increases in
marginal returns, rises with the fall in marginal returns and
remains constant with the marginal return remaining the same.
Let us suppose that the cost of each unit of factor applied is
worth $100 only.
Schedule:
|
Units of Factor
|
Total Return
(meters of Cloth)
|
Marginal Return (meters)
|
Marginal Cost (in Dollars) (per meter) |
|
1 |
10 |
10 |
10 |
|
2 |
30 |
20 |
5 |
|
3 |
55 |
25 |
4 |
|
4 |
88 |
33 |
3 |
|
5 |
138 |
50 |
2 |
|
6 |
238 |
100 |
1 |
|
7 |
338 |
100 |
1 |
|
8 |
400 |
62 |
1 |
|
9 |
450 |
50 |
2 |
|
10 |
475 |
25 |
4 |
|
11 |
490 |
15 |
6 |
In the schedule given above, the taw
of diminishing costs operates up to the 6th unit, between the
6th and 7th units, it is the law of constant costs which
prevails and from 7th unit onward, it is the law of increasing
costs which sets in.
Diagram/Graph:

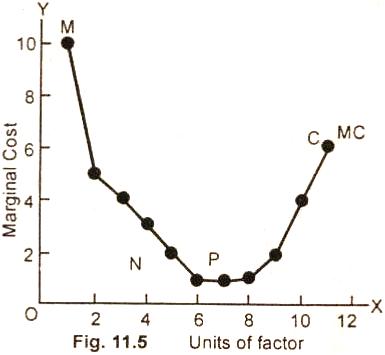
In the Fig. (11.5) units of factors
are measured along OX axis and marginal cost along OY axis. The
failing curve MN represents the operation of law of
diminishing costs. NP shows constant costs, and PC indicates the
increasing cost. MC is the marginal cost curve.
Relevant Articles:
|