Long Run Supply Curve for the Industry:
Definition and Explanation:
While
explaining the short run supply curve for the firm, we stated that the supply
curve in the short run is that portion of the marginal cost curve which lies
above the average variable cost curve, it is because of the fact that when the
variable casts of a firm are realized, the firm decides to produce the goods. In
the short run, the firm is in equilibrium when the MR is equal to MC and both
are equal to price. If this equilibrium takes place at the level above the
minimum point of ATC curve, the firm is earning abnormal profits and if it is
below the minimum point of ATC, then it is suffering losses. In the
long run, a firm cannot operate at a loss, however small it may be.
The firm
also cannot earn abnormal profits because in that case new firms enter into the
industry. The supply of the goods increases in the market and price comes down
to the level of normal price. In case of fall in demand, the capacity of the
existing firms is contracted, old firms also withdraw from the industry and thus
supply is automatically adjusted to demand. The firm, In the long run, is in
equilibrium when price = marginal revenue = marginal cost = average total cost
of the firm at the lowest point. When all the firms producing a single commodity
are in equilibrium, the industry is in full equilibrium. Each firm in the
industry is earning only normal profits.
The short
run supply curve of the industry is derived as stated earlier by the lateral
summation of that part of the marginal cost curves of all the firms which lie
above the minimum point on the AVC curves. The long run supply curve, however,
cannot be obtained by this method because in the long run the variations is
demand produce long run adjustments in the output and also in the costs of
productions of these firms. The changes in output take place because of the (1)
greater or leaser production by the existing firms, (2) entry of new firms in
the industry or withdrawals of old firms and (3) the emergence of external
economies and diseconomies.
The
emergence of external economies and diseconomies has a very important bearing on
the shape of the long run supply curve. When an industry in the long run expands
its size for greater production, it enjoys certain external economies such as
(1) technical economies, (2) managerial economies (3) communications economies,
(4) financial economies and (5) risk bearing economies. Internal economies may
also arise out of the marketing facilities enjoyed by the firms in the purchase
of raw material (6) in securing special concessional transport rates, etc., etc.
The internal economies also lead to reduction in cost.
(1) If
the size of the firm is expanded continuously, it meets diseconomies as well.
For instance, co-ordination and organization of factors become difficult (2)
capital may not be available in the required quantity (3) entrepreneurial
inertia also stands in the way of expansion of the industry (4) the prices of
raw material also increase due to greater demand by ail firms (5) the
productivity of the additional factors may also be less. The appearances of
these diseconomies result in increasing the marginal cost and average total cost
of the firms to the higher levels. If the economies and diseconomies cancel each
other, the industry wilt experience constant cost in the long run.
We,
therefore conclude that the shape of the supply curve of the industry, depends
upon the behavior of the cost in the long run.
Behavior
of the Cost:
(1) If
the industry is subject to constant cost, the shape of the supply curve will be
perfectly elastic, i.e. it will be horizontal straight line parallel to the
X-axis.
(2) If
the industry obeys the taw of increasing cost or diminishing return, the shape
of the supply curve will be positive, i.e. it will rise from left to right.
(3) If
the industry is governed by the law of diminishing cost or increasing return,
the long run supply curve will be negative, i.e., it will fall downward from
left to right.
(1)
Supply Curve of a Constant Cost Industry:
If the
supply of factors of production is perfectly elastic i.e., they can be had in as
much quantity as the firms desire without effecting the prevailing market price.
The long run supply curve of the firms will be a horizontal straight tine
parallel to the X-axis. For instance, if the paper doll industry expands its
output, an increase in demand for paper will have no perceptible effect on the
market price of the paper. It is because of the fact that its demand forms an
insignificant portion of the total supply. So is also the case with labor in the
paper doll industry. If all the firms making paper doll increase their demand
for labor, it wilt have no impact on the labor market.
In the
constant cost industry, it has been assumed, that the price of inputs do not
change as the size of industry varies. The minimum average total cost of the
firm remains constant as is explained in the diagram below:
Diagram:
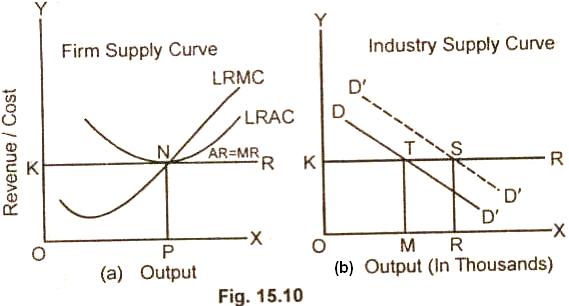
In figure
15.10(a) the firm is in the long-run equilibrium at point N where:
Price = MC = Minimum Average Cost
The firm
produces output OP and sells at price OK per unit The firm like all other firms
in the industry make normal profits. In figure 15.10(b), it is shown that when
the market demand for .a product increases, the demand curve DD/
shifts upwards. The new firms enter the industry and each firm produces at its
minimum point of average cost which is OK. The industry is thus producing any
quantity of output at a price of OK. The supply curve of the industry is
perfectly elastic at a price OK in the long run.
(2)
Supply Curve of the Increasing Cost Industry:
For the
increasing cost competitive industry, the factor prices rise with the expansion
in its production. When the demand for a good increases in the long run, the new
firms enter the industry and the existing firms expand their size for greater
production. Due to appreciable increase in demand for the scare factors, their
prices go up. The unit cost of production of all the firms in the industry tends
to rise. Thus long run average cost and marginal costs of each firm in the
industry rises above the previous level. So is also the case with minimum
average cost which rises at a higher level than before. The supply curve thus
slants upward from left to right or we say the slope of the curve is
positive. This is illustrated with the help of diagrams.
Diagram:
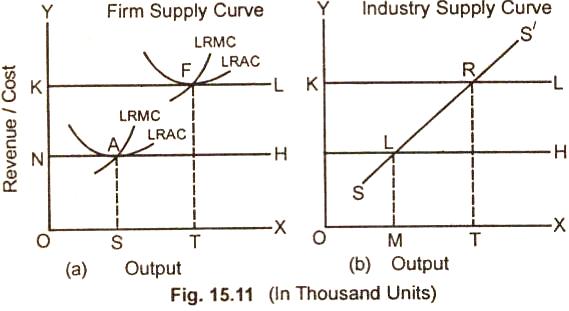
In the
figure 15.11(a) it is shown that when the demand for a commodity increases, more
firms enter into the industry. In order to attract more units of the factors,
the firms pay higher prices for them. The cost curves of the firms, move up. The
minimum average cost of the firm equals marginal cost equals price at point F.
The firm in the long run is in equilibrium at point F and produce the best level
of output OT.
When the
costs of the firms rise with the expansion of output, the supply 'curve of the
industry Fig. 15.11(b) also slants upward. The industry is now in equilibrium at
point R, with industry output OT and Price OK.
(3)
Supply Curve of a Decreasing Cost Industry:
If the
price of one or more than one input falls with the expansion of industry, the
industry is said to be a decreasing cost industry. For instance, if in a
particular industry, technological improvements in production take place and the
long run economies outweigh the long run diseconomies, then industry will be
subject to decreasing cost or increasing return. The MC, MR and minimum AC will
shift downward from the original position. The entire long run supply curve will
slant downward from left to right or it has negative slope. This is illustrated
below with the help of the curves.
Diagram:
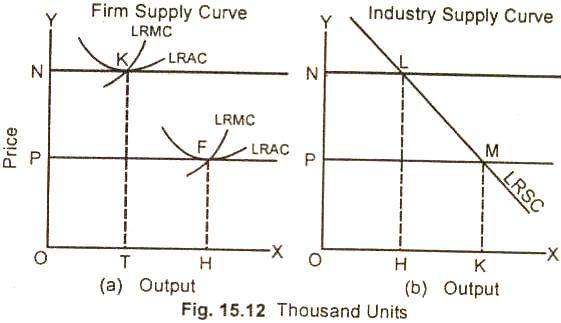
In the
Fig. (15.12) the firm is in equilibrium at point K in the long run because at
point K, MR = MC = Price = Minimum AC. It will produce OT output at price ON.
The total supply by all the firms (supply of industry) producing the commodity
at price ON will be OH. If the demand for the product increases, the existing
firms will expand their sizes and the new firms will enter the industry/Due to
technological developments and the economies of large scale production, the MC,
AC, and price fall. At the lower price OP, the firm is in equilibrium at point
F. Here MC = AC = Price. The supply of a firm increases from OT to OH at a
decreasing cost. The supply of the industry at lower price OP increases from OH
to OK. The long run equilibrium supply curve slopes downward from left to right.
Relevant Articles:
|